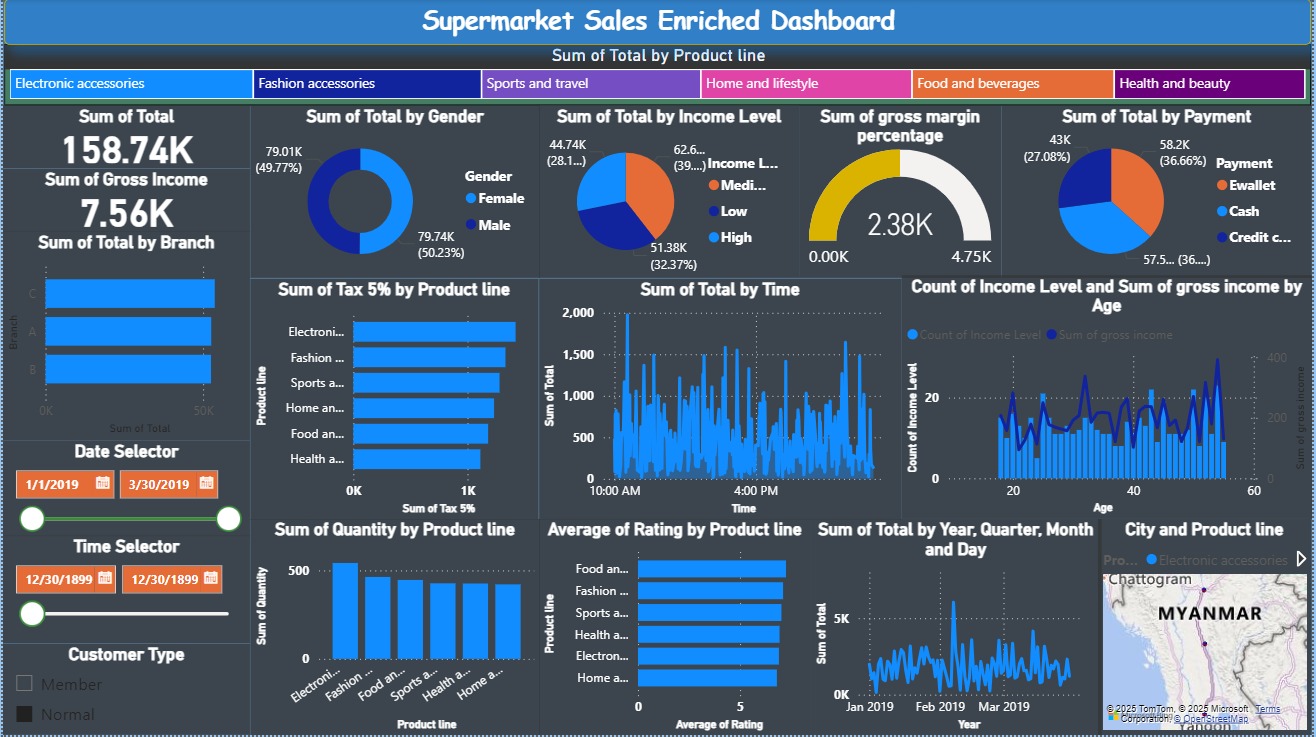
Key Insights Discovered
Sales Performance
Identified peak shopping hours and seasonal trends leading to optimized staffing and inventory management.
Customer Behavior
Discovered purchasing patterns that enabled targeted marketing campaigns and personalized promotions.
Product Performance
Pinpointed best-selling items and underperforming categories for strategic product placement.
Regional Analysis
Mapped store performance across locations to identify expansion opportunities and optimize logistics.
Data Analytics Report (DAR)
Our Analytical Approach
Data Collection & Integration
Aggregated data from POS systems, inventory databases, customer loyalty programs, and external market data sources.
Data Cleaning & Preparation
Implemented automated data validation, outlier detection, and transformation pipelines to ensure data quality.
Exploratory Data Analysis
Conducted comprehensive statistical analysis to identify patterns, correlations, and anomalies in the data.
Dashboard Development
Created interactive visualizations and KPI tracking systems for real-time business intelligence.
Insight Generation & Reporting
Transformed analytical findings into actionable recommendations with measurable business impact.
Ready to Transform Your Data?
Get actionable insights from your business data with our comprehensive analytics solutions.